Asymmetric breakup of uranium
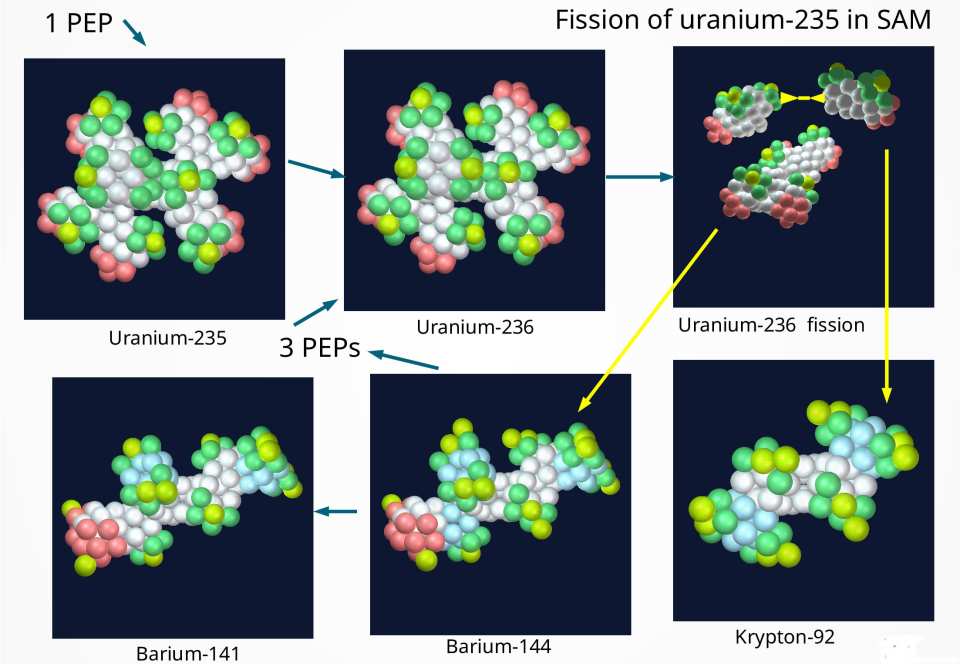
A detailed diagram of the sequence of events in the structural breakup (splitting) of uranium-235 is given in the following figure. It is not difficult to see that the two middle branches are the parts under stress and are the ones most likely to break off. We know that the addition of a single PEP i.e., a neutron, can accomplish this. But it must be slow enough so that it can be captured by the nucleus. The added PEP (noticeable as a third yellow sphere on the “equator” of U-236 in the second panel from the left) introduces enough additional stress that it causes these two branches to break off from the backbone. The responsible mechanism for fusing those broken-off branches is the postulated quasi-inner electron located between these two parts, pulling them together. The remaining backbone is the heavier fraction of the decay product, whereas the fused parts constitute the lighter fraction. Both fractions will undergo a violent resettling, resulting in radiation in the form of gamma rays, electron- and PEP emissions. These PEPs are the ones that get recycled back to the uranium-235 fuel source, allowing a chain reaction to take place. It should be obvious, that there is no reason to expect the decay products to be roughly evenly distributed, i.e., a symmetrical breakup as the “standard model” predicts.
When we count the nucleons on the remaining backbone and the broken-off branches fused together, we see an exact correspondence between the total number of nucleons in the first peak (branches) and the numbers of nucleons in the remaining backbone structure.
The second peak (backbone) is essentially constant in size when stepping through the actinides, while the first peak (the two middle branches) grows in size. This relation is clearly visible in the following figure.
SAM closely reproduces this asymmetric outcome as well as the growth of the lighter part – the nuclear structure is the reason for the asymmetric breakup.
We can therefore state that SAM naturally explains the asymmetric breakup of heavier nuclei. Looking at the data the binding energy graph is based upon, we note that uranium-236 is considerably more stressed (BE Difference: -343.37 MeV) than the combined stress of the two fission products (BE Difference: -132.01). The given BE difference is calculated as difference between the “standard model” BE and the SAM BE for a given isotope. A good part of this difference is the source of the energy release of the fission process. This relation also explains why fusion steps with a heavier base become endothermic. More and more energy needs to be spent to keep up the branches. In contrast, the conventional explanation ascribes this transition from exothermic to endothermic to the decreasing values of average BE after the peak value around iron/nickel (55-60 nucleons) in the typical published average BE graph that can be found in the literature. When fusing with oxygen, the switch to endothermic happens close to strontium.
This asymmetry of fission products is not a minor issue, but in fact is a “perennial puzzle.” Therefore, to see in SAM that this asymmetry is inherent in the structure of uranium and other actinides and that the 3:2 ratio appears quite naturally, is gratifying and strong support for the correctness of the SAM model. Of the four main categories of nuclear models that are part of the “standard model”, none can explain the asymmetric breakup of uranium and other actinides. This includes (i) the gaseous-phase (shell or independent-particle) model, (ii) the liquid-phase (liquid-drop or collective) model, (iii) the molecule-like, semisolid-phase (alpha particle or cluster) models, and (iv) several solid-phase lattice models [Models of the Atomic Nucleus, p. 20].


![ission product composition for various heavy isotopes [https://en.wikipedia.org/wiki/Nuclear_fission_product]](/sites/default/files/styles/640x480/public/image/2021-11/1024px-ThermalFissionYield.jpg?itok=wkOHfz3p)
![A summary of light and heavy fragment masses [Models of the Atomic Nucleus, 153]](/sites/default/files/styles/640x480/public/image/2021-11/asymmetry_fission.png?itok=-GI6QqvT)