Binding energy
In the discovery of the properties of the nucleus, energetic considerations, and binding energy (BE) play a major role. Empirically determined BE values through equivalence with the mass-defect are available for most nuclides, but not all. BE values are typically published as averages, on the order of 8 MeV. Some of them are only theoretically derived from the semi-empirical mass formula by von Weizsäcker or derivations thereof. This formula has five parts using volume energy, surface energy, Coulomb energy, asymmetry energy, and pairing energy-formula, while being based on the liquid-drop model. The result is a complicated function of atomic number Z and the number of neutrons N.
Usually great efforts are taken to calculate the binding energy of nuclei based on the used model to gain insight into the structure of the atoms. With SAM the approach is different. We have a structure, now we need to check if the binding energy we can calculate matches reality.
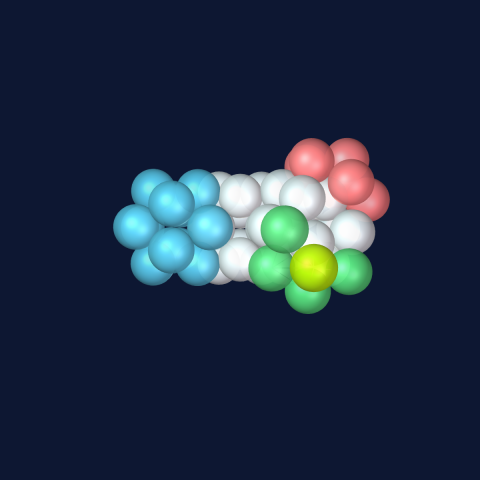
Calculating binding energy. Our calculation is based on the simplest connected structure, the deuteron – a single line with a known BE value of 2.225 MeV. As discussed before, the deuteron is composed of a proton and a PEP – or two protons and an inner electron between them. The repeating structures in the nucleus are associated with a predetermined count of those lines, based on the number of available connections between a proton and neighboring protons.
| Nucleus | # Lines | SAM Line BE (MeV) | Remarks |
|---|---|---|---|
| Hydrogen-2 | 1 | 2.225 | By definition |
| Hydrogen-3 | 2 x 2 = 4 | 8.900 | The two inner electrons are overlapping, doubling the number of lines |
| Helium-3 | 3 | 6.675 | One inner electron, no overlapping |
| Helium-4 | 6 x 2 = 12 | 26.700 | The two inner electrons are overlapping, doubling the six lines a helium-4 nucleus has |
| Lithium-6 | 15 | 33.375 | 12 lines + 6 = 18 for the new deuteron in this case. A cavity inside the structure is created, therefore one line is now broken, produced by 3 electrons covering it, so we must deduct 3, leaving 15 |
| Lithium-7 | 19 | 42.275 | The new proton–electron pair (PEP) adds four more lines |
| Beryllium-9 | 27 | 60.075 | A deuteron counts as eight lines now, because there are enough protons available, 19 + 8 |
| Boron-10 | 31 | 68.975 | The new proton–electron pair adds four more lines |
| Boron-11 | 34 | 75.650 | The new proton–electron pair adds three more lines |
| Carbon-12 | 41 | 91.225 | +5 by algorithm = 39, but by definition 41 = closest to 92.164 MeV, which is the known value of BE |
| Nuclet/ending | SAM # lines | Short code | Remarks |
|---|---|---|---|
| Prime carbon | 41 | p | See above |
| Deuteron (two-ending) | 8 | 2 | Four connections per proton |
| Four-ending | 16 | 4 | Four connections per proton |
| Five-ending | 21 | 5 | The additional proton–electron pair makes five more connections |
| Lithium nuclet | 24 | h | Four connections for one additional PEP based on the five-ending—minus one for an opened-up line (additional space); 4 - 1 = 3 |
| Beryllium ending | 32 | e | Add another deuteron = eight |
| Boron ending | 40 | b | Add another deuteron = eight |
| Carbon nuclet | 45 | c | Add another proton to reach the icosahedron structure (40), which equals five connections |
| Additional PEP | 3 | 3 | Three additional connections in a tetrahedron setup |
By multiplying the number of lines of the components with the single line value, we get the total amount of binding energy for a nucleus.
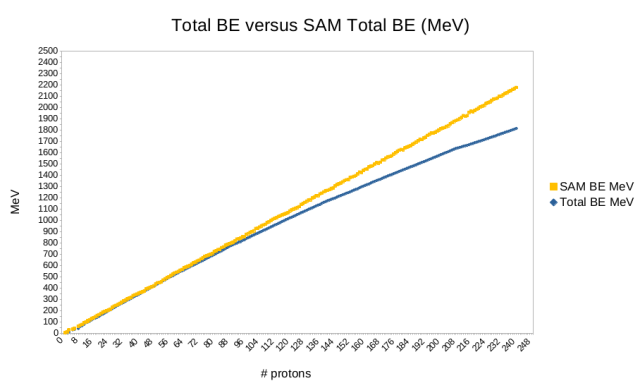
As an example we look at the structure of scandium-45 and determine the components and their line numbers using the short code defined above: p + c + c + h + 5 = 41 + 45 + 45 + 24 + 21 = 176. This equates to 391.600 MeV in SAM. The accepted value is 387.852 MeV. The results of these calculations, as compared to the published “standard model” values, are shown in this figure.
For our calculations we only add the lines of carbon nuclets and endings for each nucleus, we do not consider the positioning of the endings to each other or even the positioning of the branches relative to each other (3rd-order) as well as the elongation (4th-order) of the nucleus.
We therefore find an expected divergence from the familiar BE curve above iron/nickel, where the first significant branches start to appear. We attribute this divergence to energy inherent in the progressive distortion of the structure through branching as more nucleons are added, to the point that the nuclei become unstable. This store of energy, apparently invisible to current physics, appears to be associated with the amount of energy potentially available in a fission reaction. It can be equated to unfulfilled dense packing, energy that could be released were it not for branching. The same data set is used to display the difference between neighboring elements for both SAM and the “standard model”.
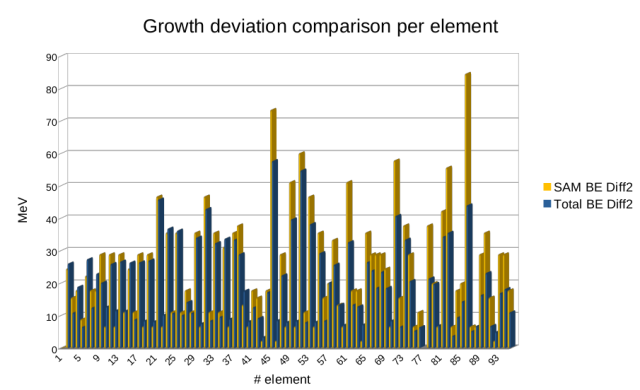
Despite individual deviations between the two series, they are clearly strongly correlated. Here we see the effect of the changing structure between one element and the next one, an effect that is hidden in the standard model data as it is normally displayed as an average value. This result shows that even a simplistic “counting of lines” has validity in revealing structural effects of the nucleus that cannot be seen in any of the versions of the "standard model".